 Skip to main content
- What is EBITDA Margin?
- How to Calculate EBITDA Margin
- EBITDA Conceptual Overview | Quick Rundown
- EBITDA Margin Formula
- What is a Good EBITDA Margin?
- EBITDA Margin vs. Operating Margin: What is the Difference?
- EBITDA Margin Calculator | Excel Template
- 1. Income Statement Operating Assumptions
- 2. EBITDA Margin Calculation Example
- 3. EBITDA Margin Ratio Analysis Example
What is EBITDA Margin?
The EBITDA Margin is a profitability ratio that compares the EBITDA of a company to its revenue in the coinciding period, expressed as a percentage.
In practice, the EBITDA margin is widely used to measure a company’s core operating efficiency and for comparability because EBITDA is unaffected by financing decisions (i.e. capital structure neutral), discretionary accounting decisions, and jurisdiction-dependent taxes.
- The EBITDA margin is the ratio between a company’s EBITDA and net revenue, expressed as a percentage.
- The EBITDA margin is a non-GAAP measure of operating performance intended to measure a company’s core profitability on a normalized basis.
- The formula to calculate the EBITDA margin divides EBITDA by net revenue in the corresponding period.
- A “good” EBITDA margin is industry-specific, however, an EBITDA margin in excess of 10% is perceived positively by most.
How to Calculate EBITDA Margin
The EBITDA margin is a measure of operating profitability, calculated as the ratio between the EBITDA of a given company and the net revenue generated in the matching period.
While revenue is the starting line item on a company’s income statement, EBITDA is a non-GAAP metric intended to represent a company’s core profitability on a normalized basis.
So in short, the EBITDA margin answers the following question, “For each dollar of revenue generated, what percentage trickles down to become EBITDA?”
The step-by-step process to calculate the EBITDA margin is as follows:
- Collect Income Statement Data → Gather the net revenue (i.e. the “top line”), cost of goods sold (COGS), and operating expenses (OpEx) amounts from the income statement.
- Retrieve Non-Cash Items from Cash Flow Statement → Obtain the depreciation and amortization (D&A) amount from the cash flow statement (CFS), including other non-cash add-backs.
- Compute EBIT → Calculate EBIT, or “operating income” by subtracting COGS and OpEx from revenue.
- Calculate EBITDA → Based on the non-cash and non-recurring items found on the cash flow statement (CFS), adjust EBIT as deemed appropriate to normalize the profit metric (e.g. treatment of D&A as non-cash add-back)
- Divide EBITDA by Net Revenue → Divide the EBITDA of the company by the corresponding net revenue figure to arrive at the EBITDA margin for the company.
EBITDA Conceptual Overview | Quick Rundown
In order to understand the importance of a company’s EBITDA margin, it is critical first to understand the importance of EBITDA – an abbreviation for the term, “Earnings Before Interest, Taxes Depreciation and Amortization” – which is perhaps the most ubiquitous measure of profitability in corporate finance.
EBITDA reflects the operating profits of a company, i.e. revenue less all operating expenses except for depreciation and amortization expense (D&A).
Because EBITDA excludes D&A, the metric is a measure of operating profitability that is not distorted by any outsized non-cash accounting charges recognized on the income statement.
By comparing EBITDA to the net revenue generated by a company, the EBITDA margin is a practical method to determine the operational efficiency of a company and its capacity to produce sustainable profits.
Learn More → EBITDA Primer
EBITDA Margin Formula
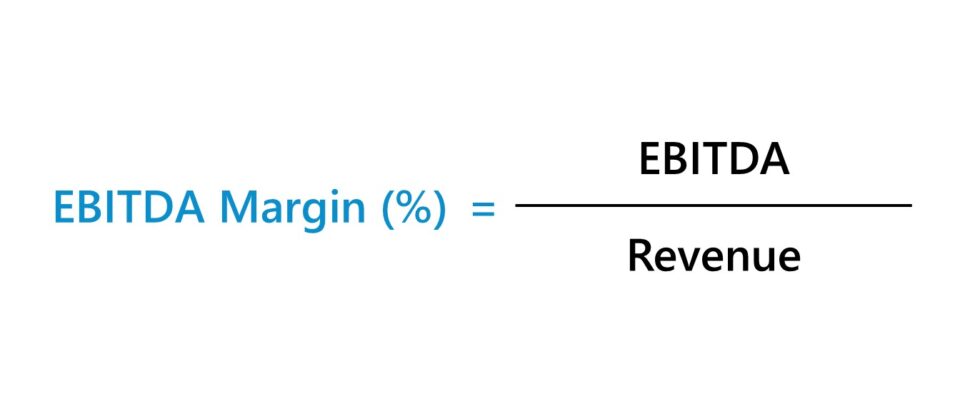
The formula for calculating the EBITDA margin is EBITDA divided by revenue, expressed as a percentage.
Where:
- EBITDA = Operating Income (EBIT) + D&A
- Net Revenue = Gross Revenue – Returns – Discounts – Sales Allowance
For instance, suppose a company generated $10 million in net revenue in 2023, while incurring $4 million in cost of goods sold (COGS) and $2 million in operating expenses (Opex).
Within the $2 million in operating expenses, $1 million in depreciation and amortization is embedded in the line item.
- Net Revenue = $10 million
- Cost of Goods Sold (COGS) = $4 million
- Operating Expenses (Opex) = $2 million
- Depreciation and Amortization Expense (D&A) = $1 million (Included in Opex)
Given those assumptions, our company’s EBITDA margin is 50%, which we determined by dividing its $5 million in EBITDA by the $10 million in net revenue it had generated.
- EBIT = $10 million – $4 million – $2 million = $4 million
- EBITDA = $4 million + $1 million = $5 million
- EBITDA Margin (%) = $5 million ÷ $10 million = 50.0%
What is a Good EBITDA Margin?
The EBITDA margin provides a picture of how efficiently a company’s revenue is converted into EBITDA.
In practice, a company’s EBITDA margin is usually used to:
- Compares against its own historical results (i.e. profitability trends from the previous periods)
- Compare vs. competitors in the same (or relatively similar) industries
For comparisons of any profit margin to be more useful, the companies chosen as part of a peer group should operate in the same industry, or in adjacent ones with similar performance drivers, in order to take into account industry-specific factors.
Generally speaking, higher EBITDA margins are perceived more favorably, as the implication is that the company is producing a higher amount of profits from its core operations.
- Higher EBITDA Margin → Companies with higher EBITDA margins relative to the industry average and vs. historical results are more likely to be more efficient, which increases the likelihood of gaining a sustainable competitive advantage and protecting profits over the long term.
- Lower EBITDA Margin → Companies with lower EBITDA margins compared to peers and declining margins could point to a potential red flag, as it implies the presence of underlying weaknesses in the business model (e.g. targeting the wrong market, ineffective sales & marketing).
Learn More → EBITDA Margin by Sector (Source: Damodaran)
EBITDA Margin vs. Operating Margin: What is the Difference?
While the EBITDA margin is arguably the most commonly used profit margin, there are others, such as the following:
- Gross Profit Margin = Gross Profit ÷ Revenue
- Operating Margin = EBIT ÷ Revenue
- Net Profit Margin = Net Income ÷ Revenue
The closest cousin of the EBITDA margin profitability metric is the operating margin—calculated as EBIT ÷ Revenue—where EBIT is defined as the revenue less all operating expenses, including depreciation and amortization (D&A).
The difference between the EBITDA and operating margin is the exclusion (i.e. in the case of EBITDA) of depreciation and amortization.
Practically speaking, that means that for a company that has D&A expenses, the operating margin will be lower in comparison.
The operating profit (EBIT) is an accrual GAAP measure of profit, whereas the EBITDA metric is a GAAP/cash hybrid profit margin.
EBITDA Margin Calculator | Excel Template
We’ll now move to a modeling exercise, which you can access by filling out the form below.
1. Income Statement Operating Assumptions
Suppose we’re tasked with calculating and comparing the EBITDA margin of three different companies.
All three companies are close industry peers and share relatively similar financials in terms of their core operations.
To begin, we’ll first list out the assumptions for revenue, cost of goods sold (COGS), and operating expenses (OpEx), as well as depreciation and amortization (D&A).
Company A, Income Statement
- Revenue = $100m
- Cost of Goods Sold (COGS) = –$40m
- Operating Expenses (SG&A) = –$20m
- Depreciation and Amortization (D&A) = –$5m
Company B, Income Statement
- Revenue = $100m
- Cost of Goods Sold (COGS) = –$30m
- Operating Expenses (SG&A) = –$30m
- Depreciation and Amortization (D&A) = –$15m
Company C, Income Statement
- Revenue = $100m
- Cost of Goods Sold (COGS) = –$50m
- Operating Expenses (SG&A) = –$10m
- Depreciation and Amortization (D&A) = –$10m
2. EBITDA Margin Calculation Example
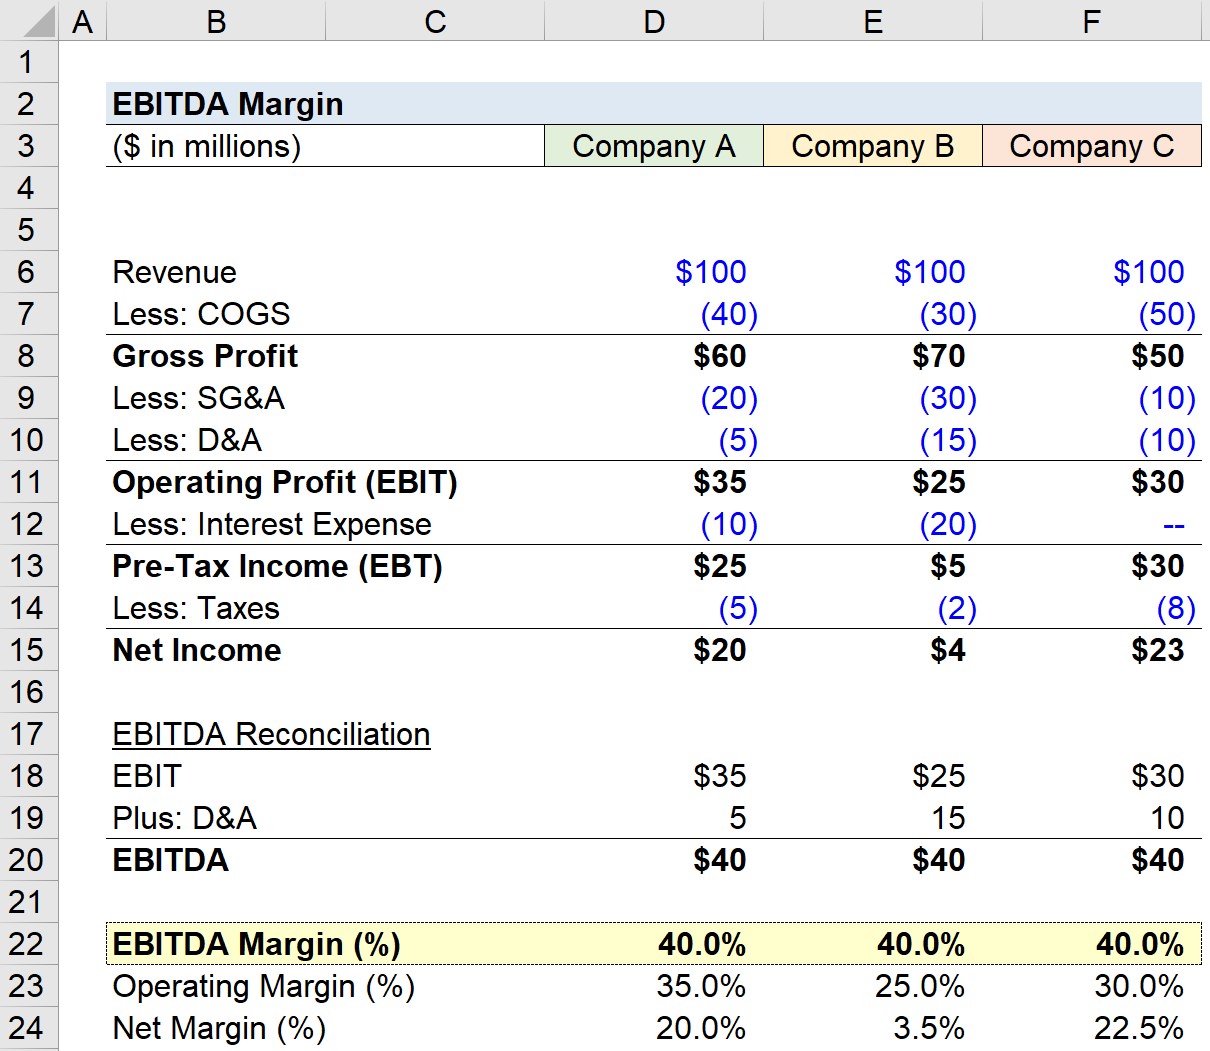
Using the provided assumptions, we can calculate the EBIT for each company by subtracting the COGS, OpEx, and D&A.
Typically, the D&A expense is embedded in either COGS or OpEx, but we have explicitly broken out the amount in this exercise for illustrative purposes.
In the following step, we’ll reconcile the amount by adding back the D&A, which results in EBITDA.
- Company A, EBITDA: $35m EBIT + $5m D&A = $40m
- Company B, EBITDA: $25m EBIT + $15m D&A = $40m
- Company C, EBITDA: $30m EBIT + $10m D&A = $40m
In the final part, the EBITDA margins for each company can be calculated by dividing the calculated EBITDA by revenue.
Upon entering our inputs into the appropriate formula, we arrive at a 40.0% margin.
- EBITDA Margin = $40m ÷ $100m = 40.0%
3. EBITDA Margin Ratio Analysis Example
The operating margin and net income margin of the companies are impacted by their different D&A values, capitalization (i.e. the interest expense burden), and tax rates.
In general, the lower on a page a profitability metric is found on the income statement, the greater the effects of the differences in discretionary management decisions related to financing as well as tax differences.
The EBITDA margins are identical for all three companies (40.0%), yet operating margins range from 25.0% to 35.0% while net income margins range from 3.5% to 22.5%.
But still, the fact that the profit metric is less susceptible to discretionary accounting and management decisions causes EBITDA to remain one of the most practical and widely accepted metrics for comparison.

Everything You Need To Master Financial Modeling
Enroll in The Premium Package: Learn Financial Statement Modeling, DCF, M&A, LBO and Comps. The same training program used at top investment banks.
Enroll Today


